Product
Pricing
Services
Customers
Gallery
Resources
Sign in
Get started
Make BI Stand for Business Improvement
Identify
Make your business visible
Explore
Find better answers quicker
Monitor
Stay closer to change
Decide
Reduce time to decision
Features
Whiteboard
Alerts
Cells
Reports
Visuals
Low-code
Count Metrics
All features
Use cases
Metric trees
Reporting
Data exploration
Data modelling
No items found.
Latest
Resources
Blog
Webinars
Podcast
Case studies
Example canvases
Data leader community
Support
Documentation
Knowledge base
SQL tutorials
Business Improvement
Identify
Explore
Decide
Monitor
Product
Whiteboard
Cells
Visuals
Alerts
Report mode
Low-code
Count Metrics
Use cases
Metric trees
Reports + storytelling
Data modelling
Data exploration
Pricing
Professional Services
Customers
Resources
Blog
Podcast
Community
Events
Docs
Sign in
Back to gallery
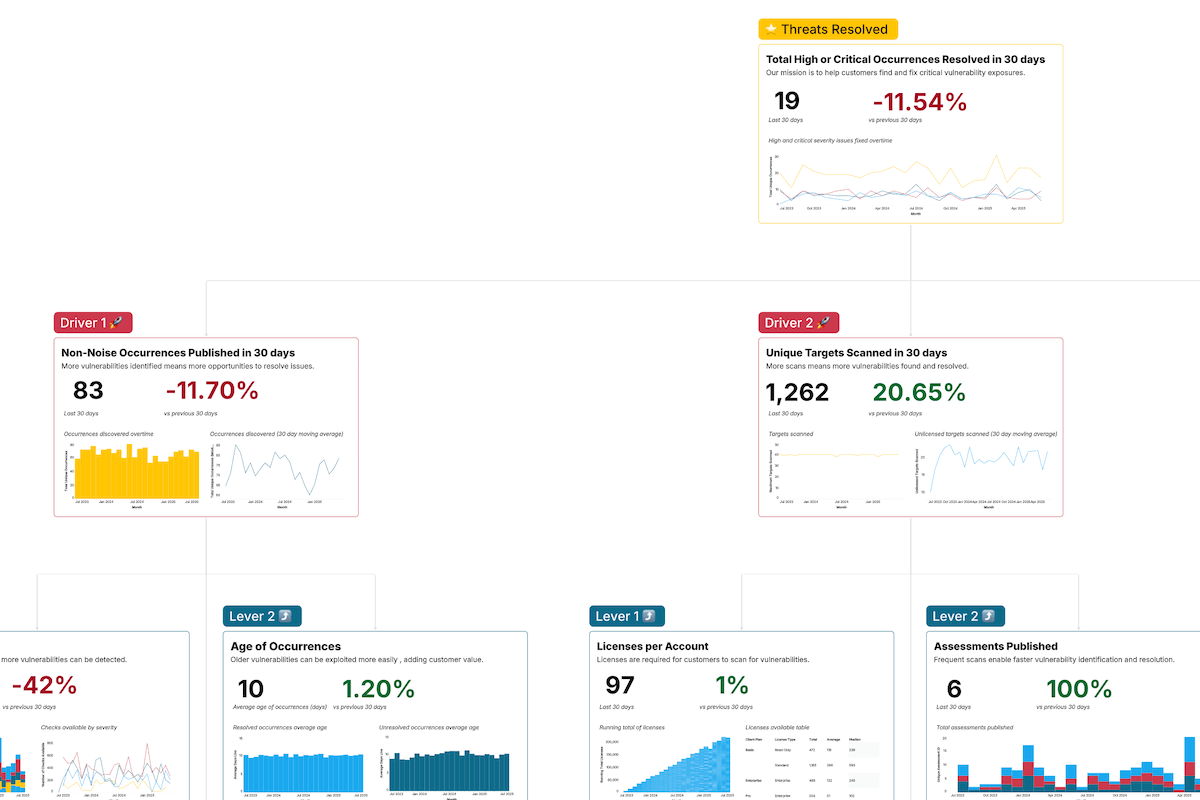
Intruder's Product Metrics Map
See how Intruder maps product metrics into a tree that helps drive more customer value and align with overall business goals.
Metric Map
Identify
Monitor
Product
SaaS
B2B
View in Count
Canvas details
Problem:
Tracking siloed product metrics brings no insight into whether a customer is finding value or how usage aligns with overall business growth.
Solution:
Intruder mapped their key product metrics into a tree with levers and drivers laddering up to an overall North Star metric.
Impact:
The product team were able to focus on moving the right usage metrics to both increase customer value and move the business forward.
Watch webinar
View in Count
Watch webinar
Related Webinar
Making OKRs Work: How Intruder Uses Data to Align Teams & Deliver Growth
August 27, 2025
Watch On-demand
Explore similar examples
Data Exploration
Break down a data request into a logical structure and present back the answer alongside the methodology to provide perfect clarity.
View →
Product Feature Usage Map
Map your product features into a hierarchical format to explore usage and pinpoint opportunities to improve usability and adoption.
View →
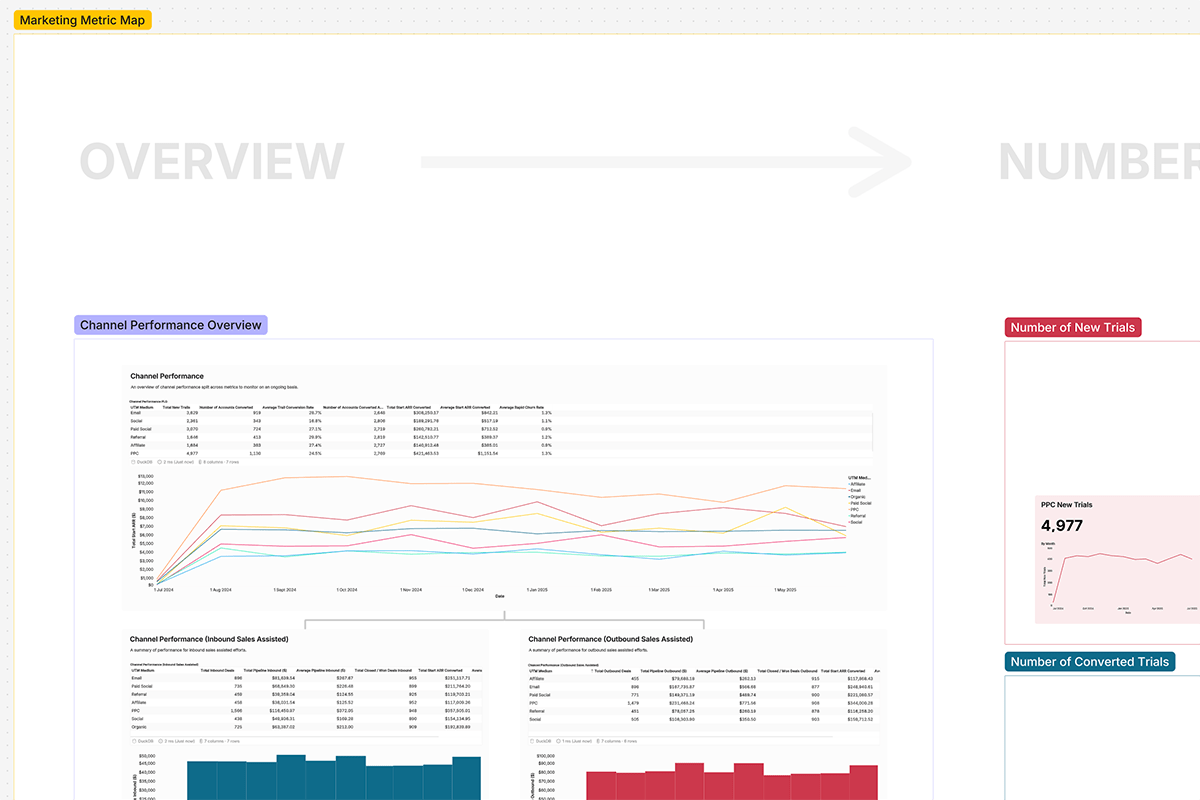
Intruder's Marketing Metrics Map
See how Intruder brought key marketing metrics into a single canvas to showcase the real go-to-market performance story.
View →
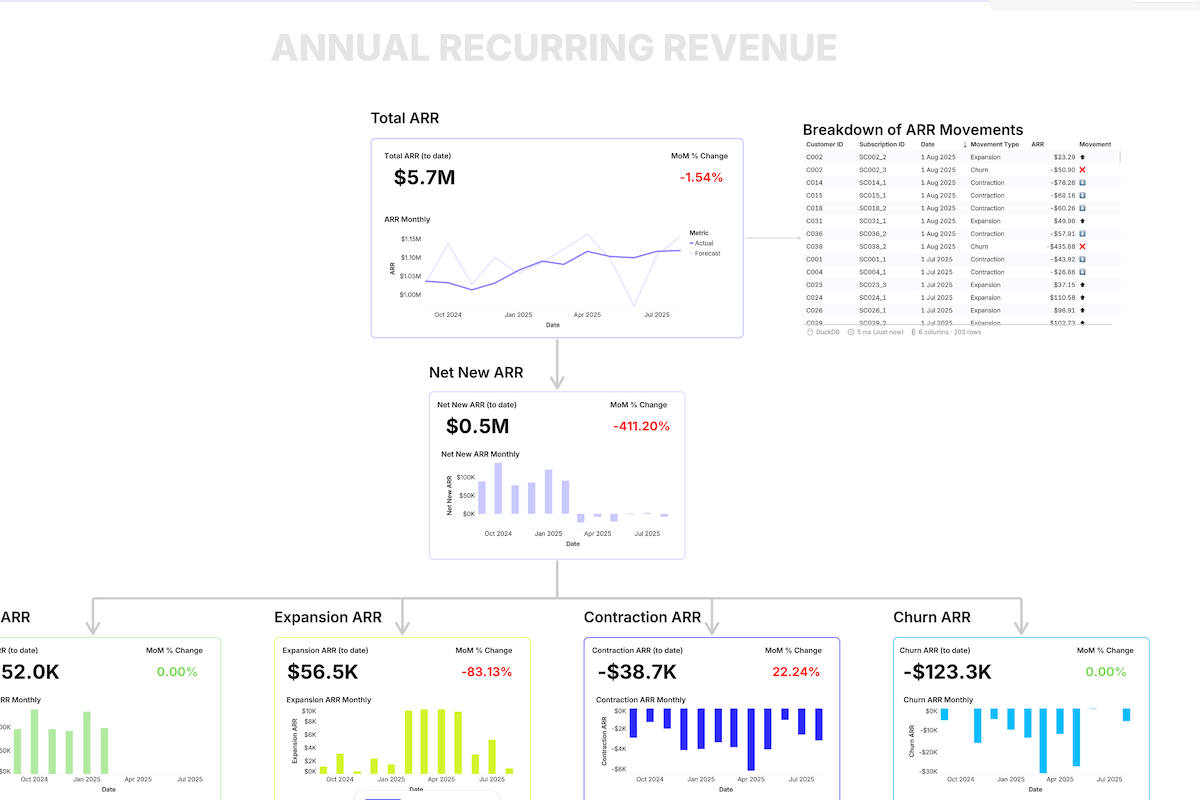
Finance Health Metric Map
Unified finance canvas to track ARR, deals, and payments in one place to monitor, prevent issues, and enable decisions.
View →
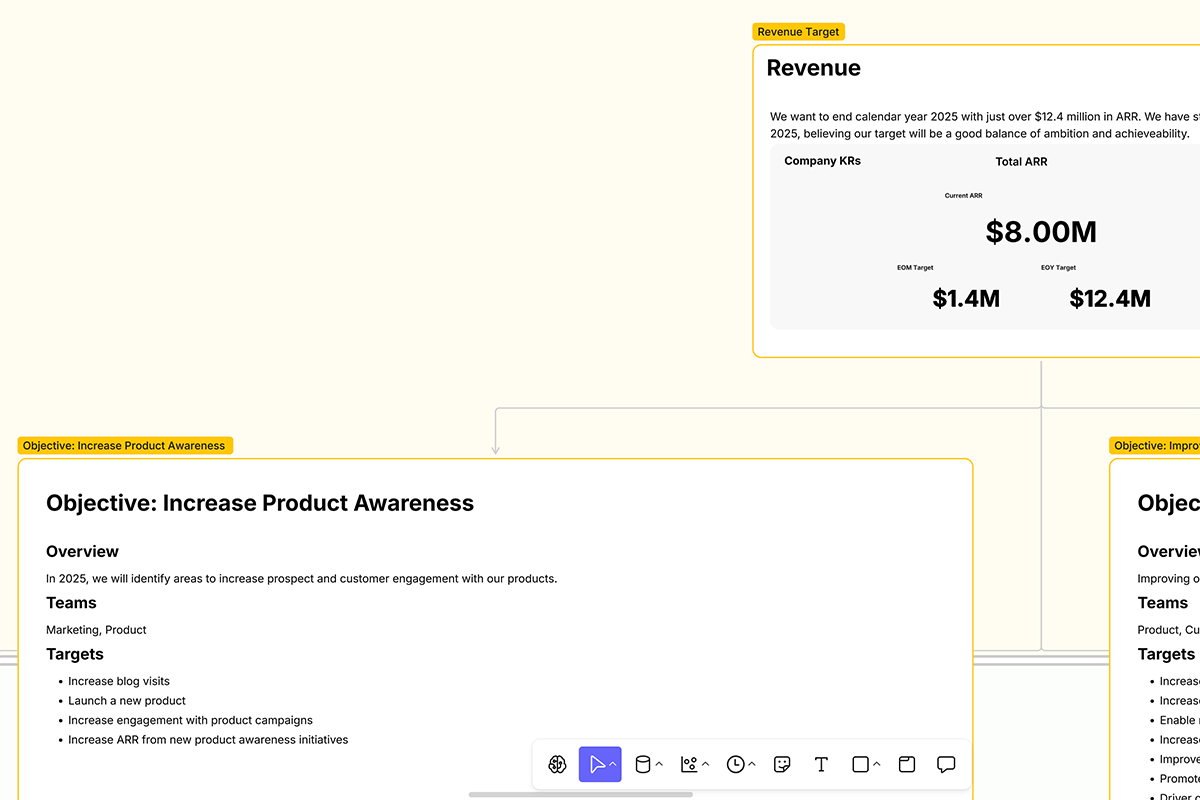
Intruder's Company OKR Canvas
See how Intruder tracks and collaborates on company-wide OKRs to get all teams pulling in the same direction.
View →
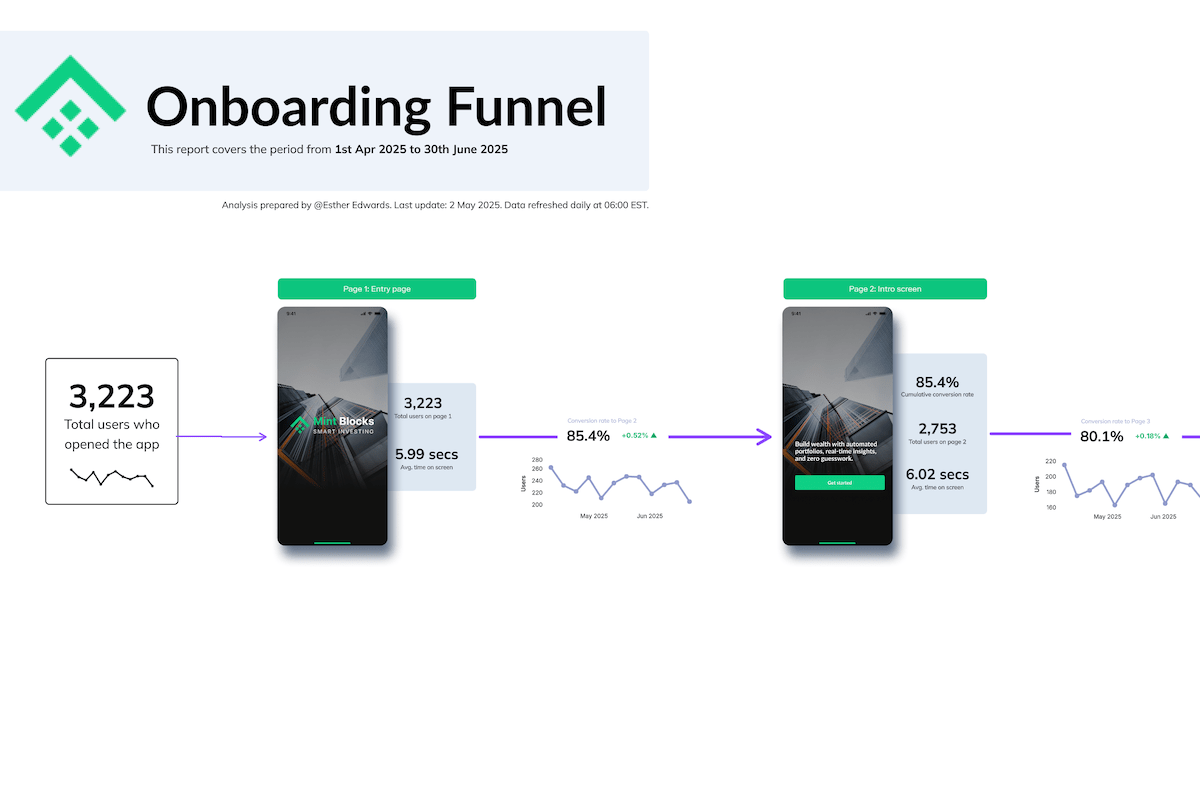
Simple Onboarding Funnel
A simple flow to track your app or software product's onboarding journey through visual screenshots and conversion data.
View →
View All Examples →